human pdac organoids (TaKaRa)
 TaKaRa is a verified supplier
  TaKaRa manufactures this product
99
Structured Review
TaKaRa
human pdac organoids
Human Pdac Organoids, supplied by TaKaRa, used in various techniques. Bioz Stars score: 99/100, based on 3765 PubMed citations. ZERO BIAS - scores, article reviews, protocol conditions and more
https://www.bioz.com/product/human+pdac+organoids/bio_rxiv__2023__04__20__537667-199-2-14?v=TaKaRa
Average 99 stars, based on 3765 article reviews
Human Pdac Organoids, supplied by TaKaRa, used in various techniques. Bioz Stars score: 99/100, based on 3765 PubMed citations. ZERO BIAS - scores, article reviews, protocol conditions and more
https://www.bioz.com/product/human+pdac+organoids/bio_rxiv__2023__04__20__537667-199-2-14?v=TaKaRa
Average 99 stars, based on 3765 article reviews
human pdac organoids - by Bioz Stars,
2026-08
99/100 stars
Images
1) Product Images from "p73 activates transcriptional signatures of basal lineage identity and ciliogenesis in pancreatic ductal adenocarcinoma"
Article Title: p73 activates transcriptional signatures of basal lineage identity and ciliogenesis in pancreatic ductal adenocarcinoma
Journal: bioRxiv
doi: 10.1101/2023.04.20.537667
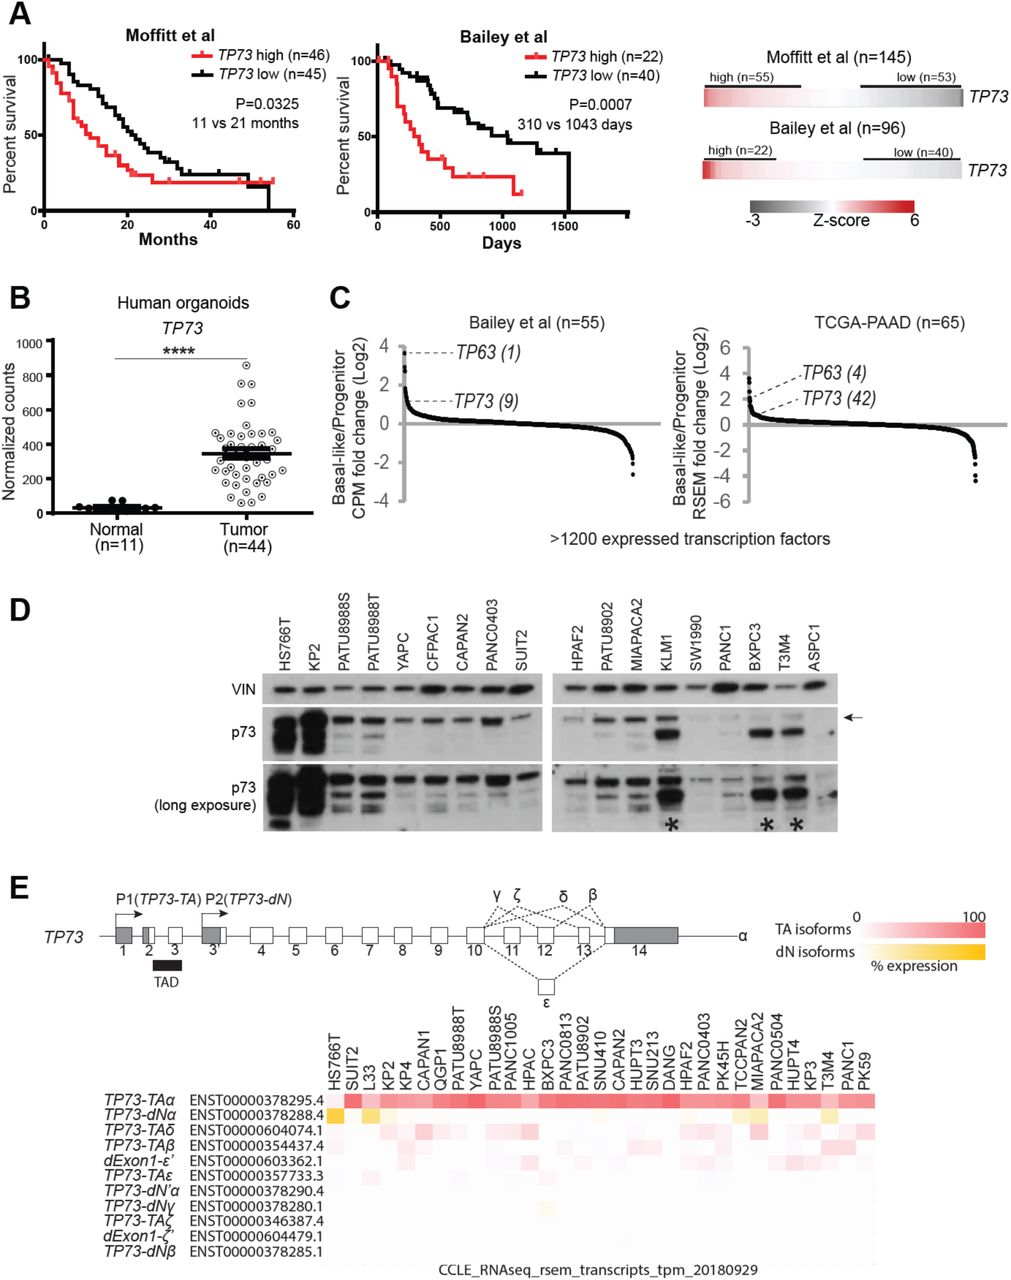
Figure Legend Snippet: ( A ) Survival curves of patients stratified by TP73 expression. Log-rank (Mantel-Cox) test used to assess the median survival values and p-values. ( B ) Expression of TP73 in human organoids derived from normal pancreata (Normal) or PDAC tumors (Tumor) . P-value calculated using unpaired t-test. ****, P ≤ 0.0001. Mean ± SEM shown. ( C ) Expression of transcription factors in the basal-like vs progenitor subtype of tumors. Transcription factors are ranked by their mean log2 fold-change in expression levels in the basal-like vs. progenitor subtype tumors. TP63 , a master regulator of the squamous subtype PDAC is shown as a reference, and the rank of each gene is written inside parentheses. ( D ) Western blot analysis of TP73 in PDAC cell lines using a pan-TP73 antibody. VINCULIN (VIN) shown as a loading control. Bands corresponding to the molecular weight of the longest p73 isoform (i.e. p73-TAα) indicated with an arrow. Asterisk points to antibody cross-reactivity with p63-dN in cell lines expressing high levels of p63-dN. ( E ) (Top) Schematic of the human TP73 gene. Exons (white boxes), UTRs (gray boxes), and introns (thin lines) are depicted. Exons are numbered. Transactivation domain (TAD) is indicated with black box. 3’ spliced isoforms are indicated in Greek letters. (Bottom) TP73 isoform expression in PDAC cell lines from CCLE . Isoforms expressed from P1 or P2 promoter are referred to as TP73-TA or TP73-dN , respectively. Isoforms lacking exon1 but retaining the transactivation domain are noted as dExon1. 3’ spliced isoforms with variations at the 3’ UTR are marked with a prime (‘) symbol (i.e. dExon1-ε’ and dExon1-ζ’). Isoform expressed from an alternative promoter other than P1 or P2 is noted as dN’ (i.e. TP73- dN’α). For the heatmap, cell lines are listed in descending order (from left to right) of total TP73 isoform expression. TP73-TA and dExon1 are collectively considered as TA isoforms, and TP73-dN and TP73- dN’ are collectively considered as dN isoforms. Expression of each isoform is normalized within a cell line (i.e. % expression = tpm value of isoform A / sum of tpm values of all isoforms * 100).
Techniques Used: Expressing, Derivative Assay, Western Blot, Control, Molecular Weight

Figure Legend Snippet: ( A ) Survival curve of patients stratified by TP73 expression. Log-rank (Mantel-Cox) test used to assess the median survival values and p-values. ( B ) Expression of TP73 in normal tissues from the GTEx project . Arrow points to pancreas tissue. ( C ) Expression of TP73 isoforms in PDAC cell lines analyzed by RT-qPCR using TP73-TA specific primers (left) or TP73-dN -specific primers (right). Expression levels of TP73 isoforms were measured relative to the expression level of GAPDH , and presented as dCT (i.e. 2 ^ -dCT) values. Mean ± SEM shown (n=3). ( D ) TP73 isoform expression in PDAC organoids derived from primary tumors (hT), metastases (hM), or fine needle biopsies of primary or metastatic lesions (hF) . For the heatmap, organoids are listed in descending order (from left to right) of total TP73 isoform expression. See figure legend for for additional details.
Techniques Used: Expressing, Quantitative RT-PCR, Derivative Assay

Figure Legend Snippet: ( A ) RNA-seq analysis following ablation of p73 in PDAC cell lines. Table summarizing GSEA analysis of the squamous subtype PDAC signature subsequent to knocking-out all isoforms of p73. ( B ) Western blot and RNA-seq analysis following p73 knock-out in hM1a PDAC organoid. GSEA plot evaluating the squamous subtype PDAC signature after knocking-out p73-TA (left) or all isoforms of p73 (right). For western blot, sgRNAs targeting all isoforms of p73 (#1and #2, red), sgRNAs targeting p73-TA (#1 and #2, green), and non-targeting sgRNA (N) are shown. Bands corresponding to the molecular weight of the longest p73 isoform (i.e. p73-TAα) indicated with an arrow. VINCULIN (VIN) shown as a loading control. ( C ) Tables summarizing GSEA analysis of signature 2 and signature 10 after activating (top) or knocking-out (bottom) p73-TA in a panel of PDAC cell lines. ( D ) Venn diagram showing number of genes overlapping between Somerville et al. squamous signature , and signature 2 and signature 10 from Chan-Seng-Yue et al. . ( E ) Expression of transcription factors in TP73 high vs TP73 low tumors. Transcription factors are ranked by their mean log2 fold-change in expression levels in TP73 high vs. TP73 low tumors. Rank of each gene is written inside parentheses. ( F ) Pearson correlation analysis of expression levels between TP73 and FOXJ1 . Pearson correlation coefficient (r) and P-value shown. ( G ) Western blot analysis of FOXJ1 subsequent to knocking-out p73. sgRNA targeting all isoforms of p73 (#1, red), sgRNA targeting p73-TA (#1, green), and non-targeting sgRNA (N) are shown. Bands corresponding to the molecular weight of FOXJ1 indicated with an arrow. VINCULIN (VIN) shown as a loading control.
Techniques Used: RNA Sequencing, Western Blot, Knock-Out, Molecular Weight, Control, Expressing